Equity and Artificial Intelligence: The Challenges of Fairness in Testing
Does ChatGPT Treat Women Unfairly?
Did you know that in France in 2023, the French Medical Association estimates that gender parity has been achieved among general practitioners (1,2)? Women will even become the majority in the coming years. Yet here are five queries submitted to ChatGPT in June 2023.

Figure 1: Queries submitted to ChatGPT in June 2023
In every instance, the sentences completed by ChatGPT established a hierarchy. The woman was placed in a role that could be perceived as socially inferior. Conversely, the man was placed on the same level as his counterpart. These responses did not align with our reality. This behavior reflects a fairness issue; the model’s responses were discriminatory toward women. This is why the latest versions of ChatGPT have been corrected. Let’s examine the mechanisms that may explain this phenomenon.
Artificial Intelligence and Data
ChatGPT is a machine learning (ML) model, a branch of artificial intelligence (AI) like FaceID or Alexa. All these tools are becoming increasingly embedded in our daily lives. Their development has accelerated even further in recent months. The stakes are immense because AI is widespread in critical systems (self-driving cars, medical imaging, aviation), and their direct impact on people’s lives is growing.
ML models rely on training based on datasets. These datasets consist of variables and a label. The model “learns” the relationships between these different variables and the label. After the training phase, providing the model with the variables of a given data point allows it to estimate the probability that the associated label will be one outcome or another. The learning process therefore requires large amounts of data to make the model perform well. This is why the datasets used must be as comprehensive as possible. However, quantity alone is not enough; the concept of representation is paramount. The dataset must represent as accurately as possible the reality of the problem the model will need to address. Otherwise, the dataset is biased and the AI becomes inaccurate. This may explain the examples presented above. Currently (October 2023), it is still possible to highlight this bias with English queries containing the term “a doctor,” which ChatGPT will most often interpret as a male physician…
Bias and Fairness
Bias refers to systematic distortions and/or subjective preferences that influence the perception and interpretation of information. Bias in data (which can never be completely eliminated, given the sheer variety of types that exist) directly impacts AI behavior. The model is then not fair, and it produces results that are themselves biased.
Fairness is the field of ML research whose objective is to evaluate and mitigate the discrimination generated by a model’s results.
The term “Fairness” could be imperfectly translated as “Ethics” or “Equity,” whose respective meanings remain somewhat vague. There is no universal definition. According to AltAI (3), “Fairness refers to a variety of concepts such as equity, impartiality, egalitarianism, non-discrimination, or justice. Fairness embodies an ideal of equal treatment between individuals and between groups of individuals. […] But fairness also encompasses a procedural aspect: the ability to seek and obtain redress when individual rights and freedoms are violated.”
AI and Its Direct Impact on People’s Lives
While the previous examples are relatively harmless, these biased results can drastically impact the lives of certain individuals. In 2016, the U.S. justice system tested COMPAS (Correctional Offender Management Profiling for Alternative Sanctions), an AI system that assigns offenders a recidivism score. This tool is made available to judges for informational purposes when they are considering releasing these convicts.
The performance of this AI-based system was quickly called into question, specifically regarding differences in how individuals are treated based on their skin color (4). The recidivism scores assigned to Black individuals are, on average, higher than those of a white individual with a comparable criminal profile.
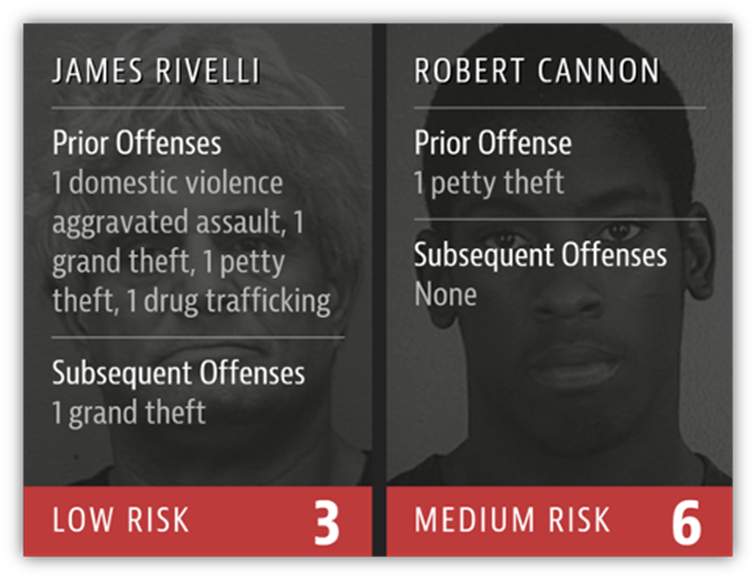
Figure 2: Criminal records of two offenders and risk scores assessed by COMPAS.
After two years of use, the behavior of those released from custody can be analyzed. The predictions made by COMPAS can be compared with real-world outcomes: specifically, did the offender reoffend or not? The model correctly predicted recidivists in 60% of cases. However, Black individuals are nearly twice as likely as white individuals to be labeled “high risk” and not to reoffend. Conversely, white individuals are nearly twice as likely as Black individuals to be labeled “low risk” and to reoffend.
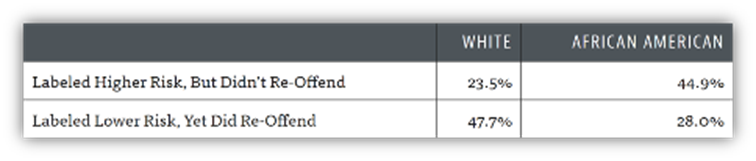
Table 1: Confusion matrix of COMPAS predictions.
These results confirm that COMPAS discriminates against individuals based on their skin color. Since Black populations are generally subject to greater police scrutiny, they are consequently arrested and incarcerated more frequently for less serious offenses. This is a significant bias! The two groups are not represented by individuals with identical average criminal records (among other factors), and therefore the model treats the two groups differently.
The redlining effect
At this point, you may be asking yourself: If telling the model which social groups individuals belong to creates discrimination, why not simply remove sensitive variables from our dataset? Indeed, if the model does not have access to individuals’ background (or any sensitive variable such as gender, age, religion, etc.), one might think it would be unable to discriminate between these groups.
However, this idea should be avoided. By simply eliminating the sensitive attribute, at best no problem will have been solved; at worst, the model will become inconsistent, its results will be completely false, and of no practical use.
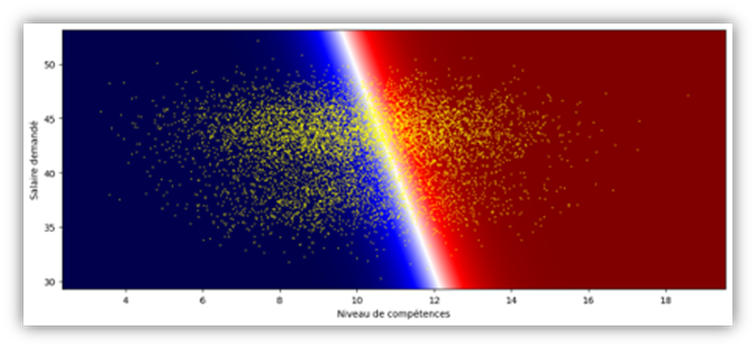
Figure 3: Illustration of the redlining effect.
Figure 3 visualizes the decision boundary of a model that recruits candidates based on various criteria. Each point represents a candidate who is plotted on the graph based on an overall skills score and their requested salary. These are the variables in the dataset. A third variable was available—the candidate’s gender—which was removed in an attempt to avoid discrimination. The white boundary line divides the space in two. The points on the red background represent the candidates the model chooses to hire, and those on the blue background represent those rejected. The slope of the boundary line shows that the model selects, from among candidates of the same level, those who ask for a higher salary. This behavior does not comply with business rules, and these results are therefore meaningless. This is a consequence of having removed access to the gender attribute from the model.
In fact, in a dataset, the various variables are correlated with one another; for example, we can expect that, on average, being a woman corresponds to a smaller height, weight, or shoe size. Very often, even without direct access to group membership, an AI model is capable of determining this characteristic indirectly based on all the other information at its disposal. This is the redlining effect. For this reason, removing the sensitive attribute generally does not prevent the model from discriminating. Worse still, when groups are very different, this simplification of the dataset leads to confusion. The model is then unable to draw relevant conclusions and produces results that no longer align with the original requirement.
Fairness Metrics
There are numerous fairness metrics designed to provide a measure of differences in outcomes and/or performance at the level of individuals or groups of individuals (5). The choice of metric depends on the type of problem and certain characteristics (legality, distribution of population groups) as well as the intended objective (6). A priority may be set so that individuals from different groups are treated equally if they have similar profiles. Conversely, one might prefer to recruit the top 20% of candidates from Group A and those from Group B, despite the difference in the overall level of the two groups. Fairness metrics therefore provide an overview of the disparity in treatment between individuals or between groups of individuals.
Mitigation methods
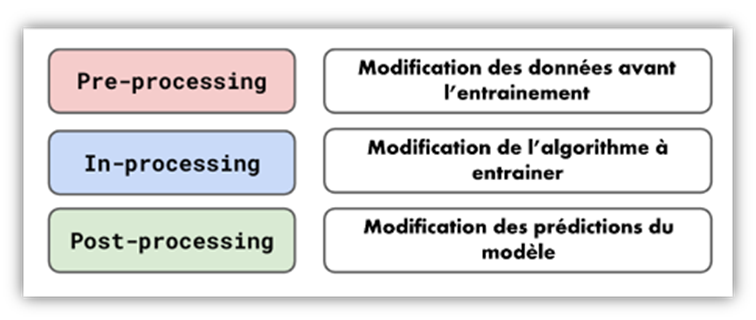
Figure 4: Bias mitigation methods are divided into three categories.
To reduce these inequalities, there are numerous mitigation methods available. They can be divided into three groups:
- Pre-processing methods, which transform the dataset before training the model.
- In-processing methods, which integrate fairness considerations directly into the model’s architecture.
- Post-processing methods, which apply corrections to the generated results.
Each method affects fairness metrics in its own way. The choice of method depends on the system’s components.
Mitigating Bias in a Practical Case
Let’s consider the Adult UCI (University of California, Irvine) benchmark dataset (7). It contains approximately 40,000 data points, each representing an individual. Each individual is described by about fifteen variables such as gender, age, number of hours worked per week, industry sector, etc. We distinguish two categories: Those earning less than $50,000 per year and those earning more. Here, we focus on gender as a sensitive variable, meaning we will observe differences in the model’s behavior toward the group of men and the group of women.
A model is trained. Based on the data, it can determine whether a person deserves a salary of “+50K” (the positive outcome) or “-50K” (the negative outcome). One potential application, for example, could be the development of an algorithm that determines the salary an individual is eligible for based on certain criteria. We will use a basic model for this type of problem: logistic regression (8).
Among all available metrics, we select conditional statistical parity (9) under the condition of the occupation variable. Its principle consists of measuring, for a given position, the proportion of positive outcomes for women and comparing it with the proportion of positive outcomes for men. A score of “0” indicates that these proportions are equal for both groups; the model is then perfectly fair according to this metric.
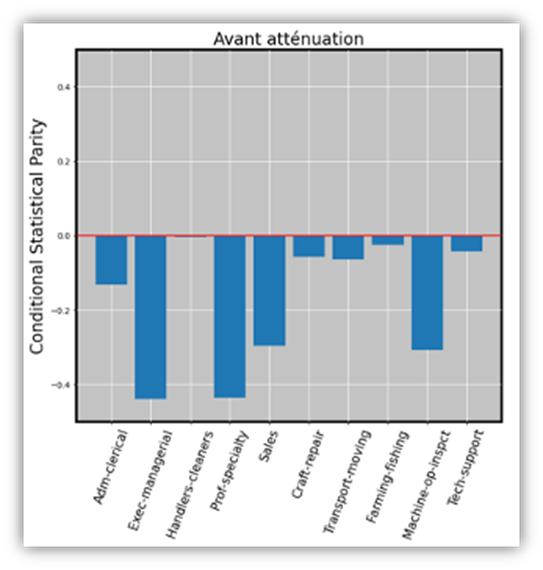
Figure 5: Regardless of occupation, women are disadvantaged by our model.
The metric is calculated for each occupation represented by a sufficiently large number of cases in the dataset. All the bars point downward. This indicates that, for each occupation, the model suggests that women should be paid “+50K” less often than men. For some professions, the figure even exceeds “-0.4,” representing a 40-point gap. For example, the model suggests that 50% of men in “Exec-managerial” roles are paid “+50K,” compared to only 10% of women.
To mitigate these disparities and return to a less discriminatory treatment of women, a mitigation technique is applied. Here, the choice is the “prejudice remover regularizer” (10), an in-processing method. A fairness term is incorporated into the cost function of the logistic regression. Here are the results:
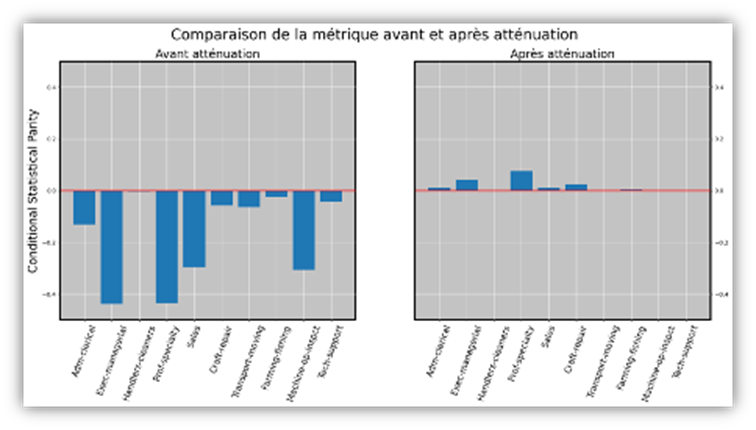
On the left, the previous graph is shown for comparison. After mitigation, on the right, all our groups now have a metric value of nearly “0.” Men and women are therefore now assigned to positive and negative outcomes in similar proportions.
What does the future hold for Fairness?
Fairness is undeniably one of the major challenges in the development of AI systems for the coming years. It is a specific form of performance measurement that is, unfortunately, too easily overlooked. It is one of the key areas for AI testing, alongside Robustness, Explainability, and Security—fields in which Kereval brings its expertise.
The effects of bias and fairness are complex phenomena that require special attention from the earliest stages of algorithm design. A deeper understanding of the mechanisms at play is essential to properly grasp the metrics and mitigation methods, which can be highly abstract.
Algorithmic discrimination is also subject to legal regulation in France, under anti-discrimination laws, and soon at the European Union level with the AI Act (11), in which issues surrounding fairness are among the central elements.
Related topics:
- Article – Explainability in AI Testing
- Article – Formal Verification of AI
- Webinar “How to Test AI” – The Tester’s Tavern
👉 Our AI offerings at Kereval: https://www.kereval.com/ai-test/